
Spreadsheet Reporting
Slow, manual and disputed
- Figures copied from several systems by hand
- Reports out of date by the time they arrive
- Different teams quoting different numbers
- Hours spent rebuilding the same reports
We bring your scattered business data together into clear dashboards and reports, so managers see what is happening, spot problems early and make faster, better-informed decisions.
CONTACT US
Business intelligence, or BI, means bringing data from your different systems into one trusted place and presenting it as clear dashboards and reports. Everyone works from the same numbers, updated automatically.
Spreadsheet Reporting
Business Intelligence
Want to know what is likely to happen next, not just what happened? See our machine learning solutions, or automate the actions behind your reports with business process automation.
Revenue trend Last 12 weeks
Revenue by region This month
Each solution turns data you already have into information your team can act on.
See performance at a glance. Interactive dashboards show sales, operations and finance figures in one place, with filters so each manager can focus on what matters to them.
No more month-end scramble. Regular reports are built and sent automatically on schedule, using the same agreed figures every time.
All your numbers in one place. We connect your CRM, accounts, e-commerce, spreadsheets and other systems so data flows together without manual copying.
A single source of truth. Data from across the business is stored, cleaned and organised in one central place, ready for reliable reporting and analysis.
Figures you can trust. We fix duplicates, gaps and inconsistent formats, and set up checks so new data stays clean as it arrives.
Understand what drives revenue. Analysis of customers, products and channels shows where sales come from, who buys again and where opportunities are being missed.
Tighter control of costs and performance. Budgets, cash flow, margins and operational measures are tracked against targets, with variances highlighted for review.
Answers without waiting for an analyst. We set up reports your team can filter and explore themselves, and train them to use them confidently.
From insight to action. When a figure crosses a limit you set, the right person is alerted or an automated workflow starts, so problems are handled sooner.
Five steps that start with the decisions your managers make and end with numbers everyone trusts.
We find out which decisions your managers make, which figures they rely on and where that data currently lives across your systems.
We agree the key measures and their definitions, map data sources, and sketch dashboards with the people who will use them.
We connect and clean your data, build the central data store and create dashboards and reports that update automatically on schedule.
We check every figure against your existing records, test with real users and fix anything that looks wrong or confusing.
We train your team, monitor data quality after launch and add new reports and measures as your business questions change.
Tell us which report takes the longest to put together. Our data analytics and BI services start with one dashboard, so you can see the difference before connecting everything else.
Projects built around tracking, reporting and clear information for decision-makers.

Development of a centralized digital STS Tracker System to monitor, manage, and report Smooth Transition Strategy implementation with automated workflows, dashboards, reporting, and stakeholder coordination.
See More Details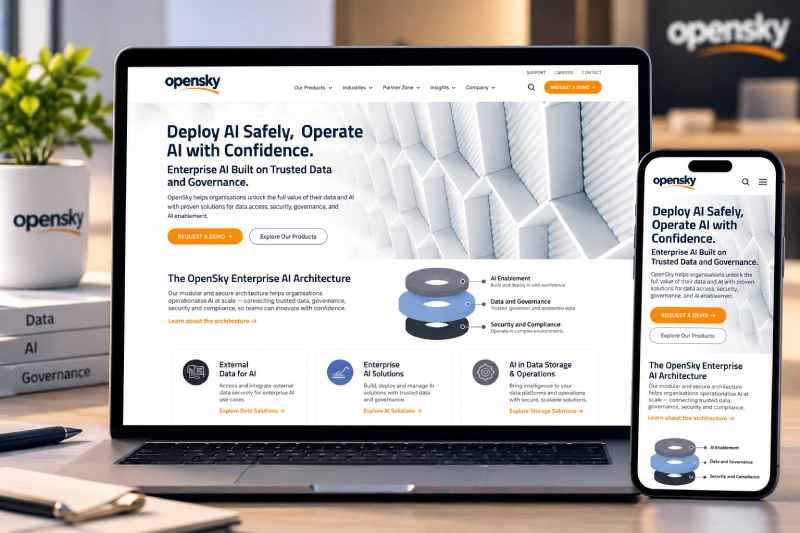
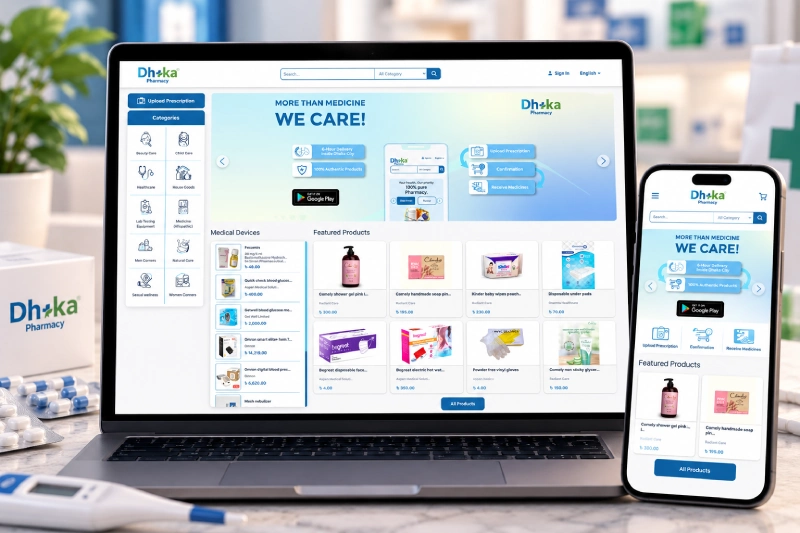

Greenville Procurement Partners (Ireland) Public procurement consultancy with 20+ years expertise, National Procurement Award winner.
See More DetailsWe build reporting around the decisions your managers make, make sure every number can be trusted and keep it simple enough to use every day.
Contact UsWe start with the questions your managers need answered, then design reports around them, not the other way round.
Every key figure has one agreed definition, so meetings discuss decisions instead of debating whose numbers are right.
We connect the software you already use, including spreadsheets, so nothing has to be replaced to get started.
Dashboards show what matters most first, with plain labels and no clutter, so anyone can read them quickly.
Built with data protection in mind, with access controls so each person sees only the data they should.
Data refreshes on schedule, so reports are always current without anyone rebuilding spreadsheets every week or month.
We show your team how to use and explore their dashboards, so insight does not depend on one person.
Start with one dashboard and add data sources, measures and AI-powered forecasting as your needs develop.
Business dashboards and reporting shaped around the measures that matter in your sector.
Combines store, marketing and stock data into dashboards showing sales, margins, returns and best-selling products.
Learn MoreTurns WooCommerce orders and customer data into clear reports on revenue, repeat buyers and product performance.
Learn MoreBuilds reporting on transactions, customer activity and operational measures, with strict access controls and audit trails.
Learn MoreTracks enrolments, course completion and learner engagement in dashboards that help educators and managers act early.
Learn MoreReports on stock levels, sales trends and supplier performance across branches for better ordering decisions.
Learn MoreBuilds transparent dashboards for service performance, case volumes and spending, supporting accountability and public reporting.
Learn MoreAdds reporting and analytics dashboards inside your own platform, so users see insights without exporting data.
Learn MoreTracks listings, enquiries, viewings and sales progress in one view, helping agencies spot bottlenecks quickly.
Learn MoreReports on matter volumes, billable time, deadlines and workload across fee earners and departments.
Learn MoreCombines donation, volunteer and programme data into clear reports for trustees, funders and annual reviews.
Learn MoreBrings finance, HR, sales and operations figures into executive dashboards with one agreed set of numbers.
Learn MoreReports on appointments, waiting times and admin workload; clinical data access follows strict professional controls.
Learn MoreTracks enquiries, bookings, revenue by package and busy seasons, helping you plan pricing and availability.
Learn MoreReports on project budgets, timelines and team workload across productions, highlighting overruns early.
Learn MoreCombines bookings, memberships, sales and marketing results to show what keeps customers coming back.
Learn MoreTracks jobs completed, team productivity, client retention and revenue by area in one simple dashboard.
Learn MoreReports on ticket sales, attendance, revenue per event and marketing performance for organisers and venues.
Learn MoreFAQ's

Data analytics and BI services bring data from your different systems together and turn it into clear dashboards and reports. Business intelligence, or BI, shows what is happening across your business, while analytics explains why, so managers can make faster, better-informed decisions. They are part of our AI & Automation services.
BI focuses on what is happening now; analytics digs into why and what could happen next. BI delivers dashboards and regular reports on agreed measures. Analytics explores patterns and causes, and can extend into machine learning forecasts. The two work best together.
Most business systems can be connected, including CRMs, accounting software, e-commerce platforms, booking systems, databases and spreadsheets. Where a system has no direct connection, we use scheduled exports or other practical methods. During discovery we map every source and confirm how each one will be connected.
No, spreadsheets can stay where they are useful. We connect them as a data source and move repetitive reporting into automated dashboards, so your team stops rebuilding the same figures. Over time, many teams choose to retire spreadsheets that are no longer needed.
The cost of data analytics and BI services depends on scope, so we quote after discovery rather than giving a fixed price. Key factors are the number of data sources, how much cleaning is needed, the number of dashboards and reports, and any software licences or ongoing support.
Timelines depend on how many systems are involved and the state of your data, so we agree a schedule after discovery rather than promising a fixed date. To start, we need access to your data sources, examples of current reports and time with the managers who use them. Contact us to begin.
Every project is built with data protection in mind. Access is controlled so each person sees only the data they should, sensitive fields can be hidden or masked, and we agree with you where data is stored and how long it is kept.
Yes. Once your data is organised, dashboards can include forecasts, anomaly alerts or plain-language questions answered by AI. We add these through our machine learning and AI integration services, starting with the measures where earlier warning would help your business most.
You measure value by comparing before and after: time spent preparing reports, how quickly managers get answers, and decisions made earlier because problems were spotted sooner. We agree these measures at the start and review them with you after launch, adjusting dashboards where they are not being used.

3 Caragh Meadows, Naas, Co. Kildare, Ireland
Noor Mansion (3rd Floor), Plot#04, Main Road#01, Mirpur-10, Dhaka-1216
Tell Us Which Report Takes The Longest To Prepare. As A Data Analytics And BI Company Based In Naas, Ireland, We Help Businesses In Ireland, The UK And The US See Their Numbers Clearly.

Sandeep Chowdhury
Founder & Chairman
Free consultation
Tell us about your project. We’ll reply within one business day with next steps.

Mamun Ur Rasid
Co-Founder & CEO
This Black Friday, we're auditing 20 websites for free. Get a report showing where visitors drop off and what fixes can help you win more sales.
$50 → FREE · Ends 27 Nov