
Manual Reports
Late and inconsistent
- Reports compiled by hand from several systems
- Different departments reporting different numbers
- Board packs that take days to prepare
- Problems spotted weeks after they start
We build management information systems and executive dashboards that bring data from every department into one clear view, giving leaders reliable reports and faster, better-informed decisions.
CONTACT US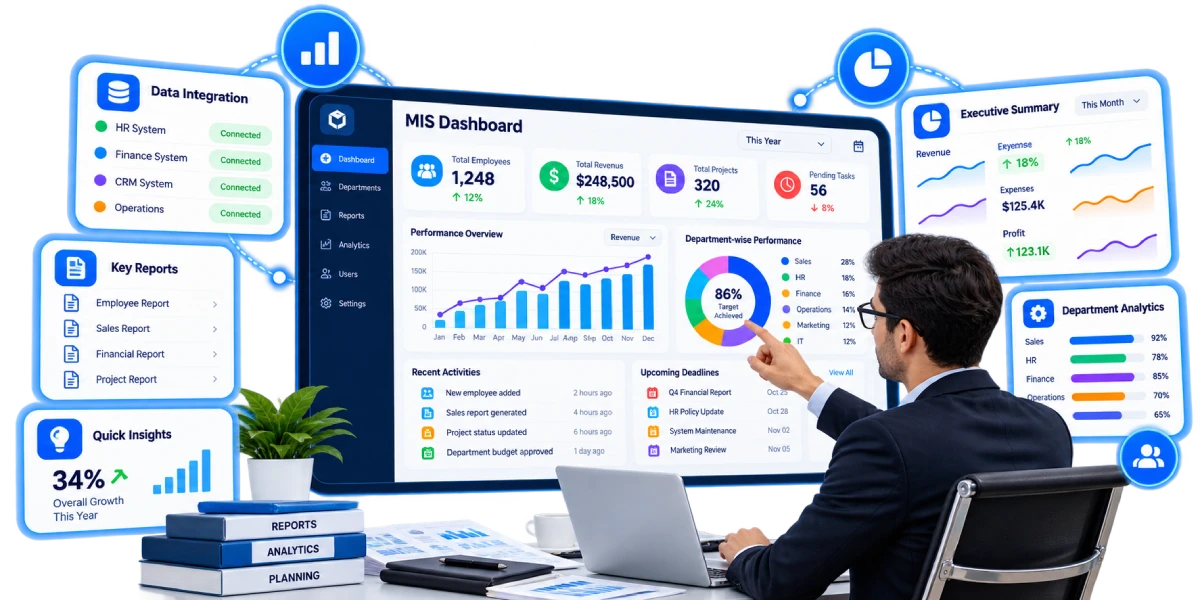
A management information system, or MIS, collects data from across your organisation and turns it into consistent reports and executive dashboards. Leaders see performance clearly without waiting for spreadsheets.
Manual Reports
MIS & Dashboards
Need deeper analysis or forecasting? See our data analytics and BI services, or connect your MIS to a custom ERP system.
Choose the reports and dashboards your leadership team needs, built on data you can trust.
The whole organisation on one screen. Leaders see revenue, costs, operations, people and projects at a glance, with clear indicators showing what needs attention.
Performance measured against goals. Set targets for each department and track progress with red, amber and green status that everyone understands.
One version of the truth. We connect finance, HR, sales, inventory, projects and spreadsheets, so every report draws from the same reliable data.
Reports without the manual work. Monthly packs, weekly updates and departmental reports are generated automatically and sent to the right people on schedule.
From headline to detail in seconds. Click any figure to see the region, department, team or transaction behind it, without asking for a new report.
The right data for each person. Directors, managers and teams each see dashboards and figures relevant to their role, with sensitive data protected.
Problems flagged early. Automatic alerts notify managers when figures cross agreed thresholds, such as overspending, falling sales or delayed projects across the organisation.
Fill the gaps in your data. Simple forms let teams submit figures that live outside other systems, with validation and approval before they reach reports.
Insights wherever leaders are. View dashboards on any device and export reports to PDF or Excel for board meetings, funders and regulators.
Five careful steps, with every figure validated, so your leaders can trust the numbers.
We meet leaders and managers to understand the decisions they make, the reports they rely on and where today's numbers fall short.
We agree KPI definitions, targets and data sources, so every department measures performance the same way from the very start.
We connect your systems and spreadsheets, clean and combine the data, and build dashboards, reports and alerts around your agreed KPIs.
We check every figure against your existing reports with finance and department heads, so leaders trust the numbers from day one.
We launch dashboards, train users and review them with leadership regularly, adding reports and KPIs as your priorities change over time.
Tell us which reports your leaders rely on and where your data lives. We will recommend an MIS and dashboard setup that gives you clear, trusted figures on schedule.
Led by our Management Information System, these platforms show how we turn complex organisational data into clear, dependable reporting.
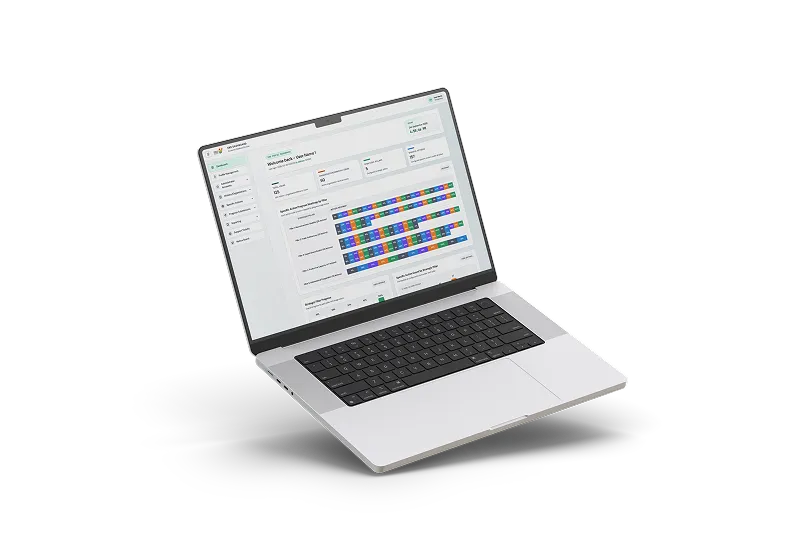
A centralised STS Tracker with automated workflows, dashboards and reporting, keeping every activity recorded and traceable, the same accountability a billing system needs for every transaction.
See More Details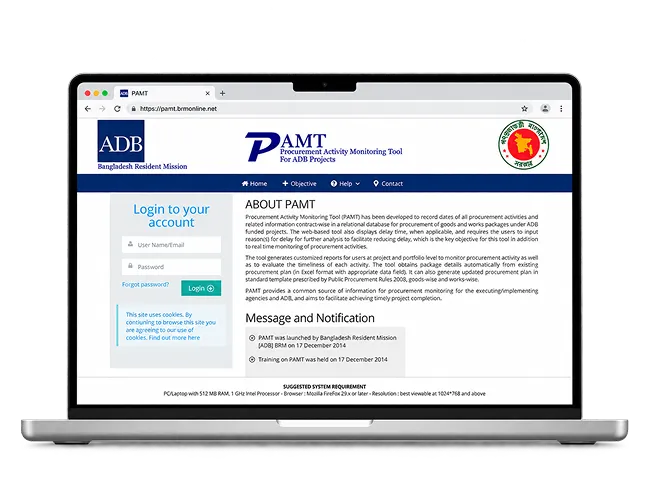
A Procurement Activity Monitoring Tool centralising procurement tracking, workflow management, reporting and performance monitoring, giving teams clear visibility of activity and spending at every stage of the process.
See More Details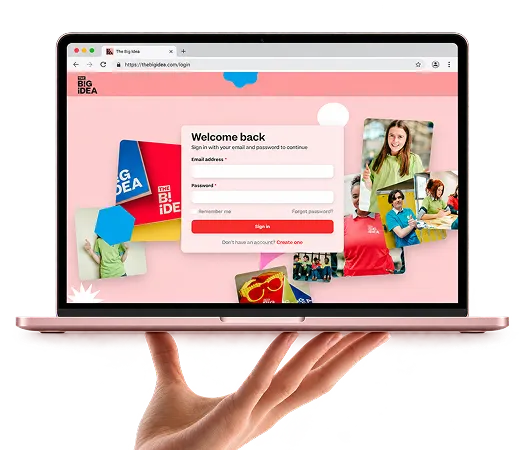
A Management Information System centralising data management, monitoring and reporting, with executive dashboards that turn raw figures into the clear, reliable reports finance leaders depend on.
See More Details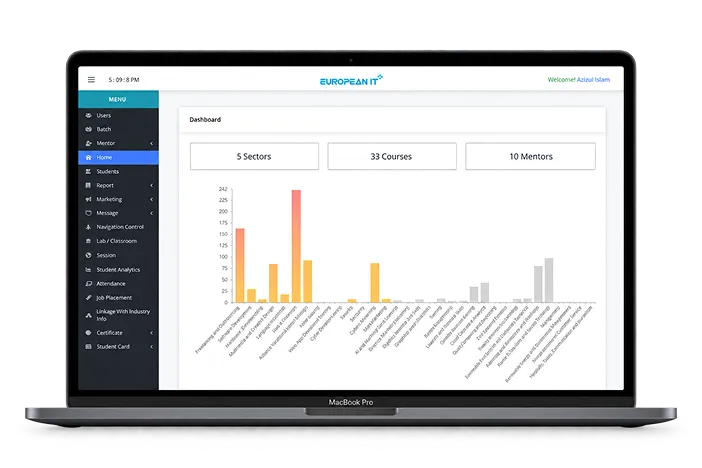
A Training Management System bringing planning, participant management, scheduling, reporting and performance tracking into one platform, giving coordinators accurate, consistent data in one organised place.
See More DetailsProven MIS experience, figures your leaders can trust and dashboards designed for decisions rather than decoration.
Contact UsWe have already delivered a centralised Management Information System, so we understand real organisational reporting.
Every KPI is defined clearly and checked against existing reports before leaders rely on it.
Dashboards focus on the questions leaders actually ask, not on charts for the sake of charts.
We pull data from your finance, HR, sales, ERP and spreadsheets, so nothing needs re-typing.
Each person sees only the data their role allows, with access and exports fully logged.
A custom MIS can avoid the per-user costs of many BI tools as more managers need access.
We train leaders and managers and keep adding KPIs and reports as priorities change.
We have built business and enterprise systems for organisations across Ireland, the UK, the US and beyond since 2009.
KPIs and reports shaped around how leaders in your sector measure performance.
Brings sales, margins, stock, returns and marketing results into one dashboard for faster trading decisions.
Learn MoreTurns WooCommerce orders, customers and product data into clear dashboards for store owners and managers.
Learn MoreDelivers secure management and board reporting with clear KPI definitions, audit trails and role-based access.
Learn MoreReports on enrolments, attendance, results and finances across campuses for leadership and governing boards.
Learn MoreCompares sales, stock and staffing across branches in one dashboard, highlighting where action is needed.
Learn MoreProvides transparent programme, budget and performance reporting for leadership, oversight bodies and funders.
Learn MoreAdds management dashboards and reporting to your own platform, drawing on the data it already holds.
Learn MoreTracks listings, sales, lettings, occupancy and agent performance in one clear dashboard for directors.
Learn MoreReports on fee income, matters, utilisation and debtors, giving partners a clear view of firm performance.
Learn MoreTurns programme, fundraising and spending data into clear reports for trustees, funders and leadership teams.
Learn MoreConsolidates KPIs across departments, regions and entities into one executive view and automated board packs.
Learn MoreReports on appointments, staffing and practice finances for managers; clinical data stays in clinical systems.
Learn MoreShows bookings, revenue, enquiry conversion and seasonal trends so creative owners can plan ahead with confidence.
Learn MoreTracks project budgets, timelines and profitability across productions in one clear management view.
Learn MoreBrings memberships, bookings, sales and retention figures together across locations in one dashboard.
Learn MoreReports on jobs completed, staff hours, contracts and profitability by site and client.
Learn MoreTracks ticket sales, event budgets and attendance before, during and after every event.
Learn MoreFAQ's

A management information system, or MIS, collects data from across your organisation and turns it into consistent reports and dashboards for managers and leaders. It helps you monitor performance, spot problems early and make better-informed decisions. It is part of our Enterprise Solutions.
An executive dashboard is a single screen showing the key figures leaders care about, such as revenue, costs, sales, staffing and project progress. Clear indicators show what is on track and what needs attention, with drill-down to the detail behind each number.
An MIS focuses on consistent, scheduled reporting of agreed KPIs for managing the organisation day to day. Business intelligence goes further, exploring data to find trends and answer new questions. Many organisations start with an MIS and add deeper analytics later.
The cost of MIS and executive dashboard development depends on the number of data sources, KPIs, users and reports you need. Phased delivery lets you start with a core executive dashboard and add departments over time. We provide a clear estimate after reviewing your reporting needs.
It depends on how many systems hold your data and how clean that data is, so we agree a timeline after the review. A first executive dashboard can often launch early. To start, we need your current reports, KPI list and access to data sources. Contact us to begin.
Yes. We connect to your finance, HR, sales, inventory, project and ERP systems, as well as spreadsheets and databases. Where a system cannot connect directly, we use scheduled imports or simple data entry forms, so nothing is left out of your reports.
It depends on your data sources and needs. Many figures can update automatically every hour or overnight, while some, such as monthly finance figures, update once they are finalised. Each dashboard shows when its data was last refreshed, so leaders know how current it is.
Access is role-based. Directors might see the full organisation, while managers see their own department and teams see their own targets. Sensitive figures such as salaries can be restricted, and all access and exports are logged for security and audit purposes.
Yes. We built a centralised Management Information System that streamlines data management, reporting, monitoring and organisational decision-making. That experience shapes how we define KPIs, combine data from different sources and design dashboards that leaders and managers actually use every day.
3 Caragh Meadows, Naas, Co. Kildare, Ireland
Noor Mansion (3rd Floor), Plot#04, Main Road#01, Mirpur-10, Dhaka-1216
Tell Us Which Reports Your Leaders Rely On And Where Your Data Lives. From Our Offices In Naas, Ireland And Dhaka, Bangladesh, We Build MIS And Executive Dashboards For Organisations In Ireland, The UK And The US.

Sandeep Chowdhury
Founder & Chairman
Free consultation
Tell us about your project. We’ll reply within one business day with next steps.

Md. Mamun Ur Rasid
Co-Founder & CEO